Uptrend on the daily chart: above its 50- and 200-day averages · 50-day above the 200-day · SuperTrend up since Sep 30 · above the Ichimoku cloud · RSI 100 (overbought) · MACD above its signal
None of the 29 investors followed here reported a position in ELST in their latest filing.
From each investor's quarterly 13F filing with the SEC: positions at the quarter's end, reported up to 45 days later. All investors
No member of Congress has disclosed a ELST trade since 2025.
From House and Senate STOCK Act reports. Members disclose trades, not holdings, as value ranges up to 45 days later, so amounts are estimates and “last move” is a hint at who still holds it, not a position. All recent congress trades
No insider transactions reported for ELST.
| Year | Jan | Feb | Mar | Apr | May | Jun | Jul | Aug | Sep | Oct | Nov | Dec | Year |
|---|---|---|---|---|---|---|---|---|---|---|---|---|---|
| 2026 | -36.0 | 0.0 | 215.6 | -1.0 | 0.0 | 0.0 | 0.0 | 0.0 | 20.0 | 0.0 | +140.0% | ||
| 2025 | -30.0 | -10.0 | 15.9 | 34.9 | -30.4 | 46.1 | -85.0 | 0.0 | -26.7 | 81.8 | 0.0 | 25.0 | −75.0% |
| 2024 | -15.3 | 4.4 | 9.2 | -8.6 | -6.4 | 70.0 | -44.2 | 0.0 | -16.0 | 4.8 | -47.7 | -13.1 | −68.7% |
| 2023 | 45.8 | -25.7 | 7.7 | -4.5 | -5.8 | -2.8 | 22.4 | 0.1 | -6.6 | -4.7 | 19.4 | 0.0 | +32.9% |
| 2022 | -3.7 | -7.9 | 0.0 | 1.1 | 0.0 | 1.9 | 0.3 | 0.0 | 0.0 | 5.1 | -30.8 | 19.5 | −20.3% |
| 2021 | -6.9 | 39.3 | -6.1 | 38.8 | -24.3 | -9.7 | 39.1 | -12.0 | 12.0 | -20.9 | -3.6 | -14.0 | +3.8% |
| 2020 | 21.0 | -16.3 | -7.1 | 31.2 | -40.0 | -4.3 | -13.2 | 26.5 | -36.5 | 50.0 | -10.0 | 7.4 | −28.4% |
| 2019 | 15.4 | 0.0 | -8.9 | 0.0 | -4.4 | 2.0 | 1.2 | 3.8 | 0.0 | 1.3 | -3.8 | -1.2 | +3.8% |
| 2018 | 25.0 | -35.4 | 7.1 | 0.0 | -2.7 | -4.1 | 31.0 | -16.4 | 19.6 | 18.2 | -40.0 | 0.0 | −25.0% |
| 2017 | 0.0 | 1.2 | 0.1 | -1.3 | 5.3 | -5.0 | -0.0 | 43.7 | 8.2 | -12.9 | -12.5 | 15.6 | +36.8% |
| 2016 | 2.4 | 0.0 | 0.0 | 2.6 | 0.0 | 2.6 | -2.5 | 9.9 | -11.3 | 18.4 | -6.7 | -9.5 | +2.4% |
| 2015 | -2.3 | -4.6 | 2.5 | -2.6 | 0.0 | -4.7 | 0.0 | 7.6 | -4.9 | -2.3 | -2.6 | 0.0 | −13.7% |
| 2014 | 11.4 | -2.6 | 2.9 | 4.8 | -9.1 | 17.5 | 6.4 | 10.0 | 3.2 | -17.5 | -14.5 | 7.5 | +14.4% |
| 2013 | 44.0 | -2.8 | 0.0 | 8.6 | -21.1 | 29.3 | -9.8 | 5.7 | -8.1 | 15.6 | -4.3 | 0.0 | +50.4% |
| 2012 | 0.0 | -8.1 | -5.9 | 0.0 | 3.1 | -23.9 | 0.0 | 4.4 | 13.5 | 0.0 | -15.9 | 0.0 | −32.4% |
| 2011 | -0.1 | -24.8 | 35.3 | 11.9 | -10.6 | 1.7 | 0.0 | -18.3 | -2.0 | 0.0 | -20.8 | -2.6 | −36.2% |
| 2010 | -16.4 | 19.6 | -27.3 | 0.0 | 12.5 | -4.4 | 11.6 | -22.9 | 37.8 | -11.8 | 22.2 | 5.5 | +5.5% |
| 2009 | 3.2 | -12.2 | -14.6 | 12.5 | 40.7 | -23.7 | 0.0 | 6.9 | 0.1 | 62.5 | -20.6 | 37.5 | +77.4% |
| 2008 | 12.9 | -11.5 | -5.9 | -6.3 | -4.0 | -8.3 | -3.0 | -14.1 | -27.3 | 0.0 | 22.5 | -36.7 | −63.5% |
| 2007 | 4.7 | 0.0 | -1.5 | 7.6 | 69.0 | -3.3 | -10.3 | -3.8 | -4.0 | -11.5 | 1.2 | -1.2 | +32.8% |
No analyst coverage for this instrument.
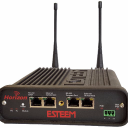
Electronic Systems Technology, Inc., doing business as ESTeem Wireless Modems, designs, develops, manufactures, and markets industrial wireless products and accessories in the United States and internationally. The company's ESTeem industrial wireless products provide communication links between computer networks, network enabled devices, and mobile devices without cables. It also offers data radio products for process automation in commercial, industrial, and government arenas, as well as various accessories, such as antennas, power supplies, and cable assemblies. In addition, the company provides repair and upgrade services; and professional services, such as site survey testing, system start-up, and custom engineering. Its products are used in various applications, including water/wastewater, oil/gas, mining, and industrial automation. It markets its products through direct sales, sales representatives, and domestic, as well as foreign, resellers. The company was incorporated in 1984 and is based in Kennewick, Washington.
No recent headlines.