No House member has disclosed a BVN trade since 2025.
From the House's STOCK Act reports (Senate not included). Members disclose trades, not holdings, as value ranges up to 45 days later, so amounts are estimates and “last move” is a hint at who still holds it, not a position. All recent congress trades
No insider transactions reported for BVN.
| Year | Jan | Feb | Mar | Apr | May | Jun | Jul | Aug | Sep | Oct | Nov | Dec | Year |
|---|---|---|---|---|---|---|---|---|---|---|---|---|---|
| 2026 | 23.1 | 27.5 | -17.5 | -9.6 | 13.2 | -20.6 | 3.4 | 13.3 | -7.9 | 2.3 | +16.1% | ||
| 2025 | 10.8 | -0.1 | 22.6 | -9.4 | 5.8 | 9.6 | 3.6 | 12.5 | 27.1 | -6.4 | 8.8 | 12.3 | +141.6% |
| 2024 | -0.5 | -0.5 | 5.2 | 8.9 | 3.5 | -5.3 | -8.6 | -20.0 | 11.6 | -5.6 | -7.4 | -4.8 | −24.4% |
| 2023 | 8.6 | -6.3 | 7.9 | -13.6 | -3.7 | 7.9 | 5.0 | 10.6 | -0.2 | -4.9 | 17.8 | 59.7 | +104.6% |
| 2022 | 10.7 | 22.2 | 1.7 | -6.3 | -9.5 | -22.7 | -17.6 | -2.2 | 26.5 | 3.1 | 17.6 | -8.7 | +1.8% |
| 2021 | -16.5 | 8.6 | -9.3 | -3.1 | 18.5 | -21.4 | -8.7 | -9.2 | -9.9 | 16.6 | -7.2 | 0.1 | −40.0% |
| 2020 | -14.4 | -13.8 | -34.6 | 2.7 | 4.8 | 16.4 | 29.8 | 18.7 | -13.2 | 0.4 | -9.5 | 9.8 | −19.3% |
| 2019 | -3.5 | 6.3 | 3.8 | -6.2 | -6.4 | 9.9 | -8.6 | 0.0 | -0.4 | 1.1 | 0.2 | -1.8 | −6.9% |
| 2018 | 9.6 | 0.8 | -2.1 | 4.7 | -3.0 | -11.9 | 0.8 | -8.4 | 6.5 | 3.2 | 2.2 | 14.7 | +15.2% |
| 2017 | 22.3 | -10.8 | -2.1 | -0.2 | 3.6 | -7.6 | 6.4 | 9.7 | -4.8 | 7.8 | 1.5 | 0.6 | +24.8% |
| 2016 | -6.5 | 30.5 | 41.0 | 37.9 | -5.8 | 25.0 | 22.6 | -15.6 | 12.0 | -4.0 | -16.0 | 1.0 | +163.6% |
| 2015 | 19.5 | 1.4 | -12.5 | 10.4 | 0.2 | -7.3 | -31.4 | -11.2 | -5.7 | 7.6 | -26.1 | -9.7 | −55.2% |
| 2014 | 10.5 | 1.6 | -0.2 | 3.4 | -17.8 | 10.5 | -0.8 | 24.3 | -20.5 | -20.6 | 0.5 | 3.4 | −14.8% |
| 2013 | -17.7 | -13.4 | 1.3 | -22.9 | -10.3 | -17.8 | -3.1 | -11.7 | -7.3 | 23.8 | -18.6 | -4.9 | −68.8% |
| 2012 | 11.9 | -6.5 | 0.4 | 2.4 | -5.2 | -3.0 | -4.1 | -4.8 | 12.4 | -8.2 | -8.4 | 9.7 | −6.2% |
| 2011 | -16.3 | 13.8 | -7.9 | -3.0 | 5.9 | -13.9 | 7.8 | 14.4 | -19.4 | 8.5 | -4.3 | -2.1 | −21.7% |
| 2010 | -5.9 | 6.8 | -7.9 | 6.2 | 9.5 | 6.8 | 0.4 | 7.1 | 9.3 | 17.1 | -4.3 | -3.3 | +46.3% |
| 2009 | -5.4 | 2.2 | 24.5 | -11.8 | 33.9 | -15.2 | 8.4 | -3.0 | 39.3 | -4.7 | 19.6 | -16.6 | +68.0% |
| 2008 | 18.4 | 13.4 | -9.9 | -8.7 | 5.2 | -0.7 | -17.7 | -13.8 | 1.2 | -46.2 | 42.4 | 10.7 | −29.6% |
| 2007 | 3.0 | -4.2 | 8.1 | 8.8 | 2.9 | 11.7 | 6.5 | -4.2 | 25.0 | 20.2 | -2.8 | 1.4 | +101.7% |
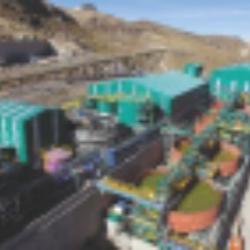
Compañía de Minas Buenaventura S.A.A., together with its subsidiaries, engages in the exploration, development, construction, and operation of mines in Peru, the Americas, Europe, and Asia. It explores for gold, silver, copper, zinc, lead, and antimony deposits. The company also engages in the exploration, extraction, concentration, smelting, and marketing of polymetallic minerals and metals. In addition, it is involved in electricity transmission and generation; hydroelectric plant operation; and production of manganese sulfate monohydrate, as well as tailings dam management. The company was incorporated in 1953 and is based in Lima, Peru.
Buy / hold / sell counts